| Home | About | Archives | RSS Feed |

State Jobless Rate Drops for April
 BOSTON — The Executive Office of Labor and Workforce Development reported today that the total unemployment rate in April was 7.8 percent, down 0.2 of a percentage point from the 8.0 percent March rate. The preliminary April job estimates show 3,228,000 jobs in Massachusetts, an increase of 19,500 jobs. The private sector added 20,500 jobs.
Job gains occurred in Leisure and Hospitality; Trade, Transportation, and Utilities; Education and Health Services; Manufacturing; Professional, Scientific, and Business Services; Financial Activities; Construction; Information; and Mining and Logging. Government and Other Services lost jobs. The April job gain follows a revised 1,300 jobs loss in March, previously reported as a 3,200 job gain. Over-the-year, jobs are up 40,800 (+1.3 percent) with private sector jobs up 47,200 (+1.7 percent). Since January 2011, 34,200 jobs have been added in the Commonwealth.
The Massachusetts unemployment rate remains below the national rate, which is 9.0 percent. In April, the number of Massachusetts residents employed grew and those unemployed decreased resulting in a decline in the unemployment rate. Trends for the labor force, unemployed residents, employed residents, the unemployment rate and jobs continue to indicate improvement for the Commonwealth's economy.
| Tags: jobs, unemployment |
Pittsfield Job Fair Draws Hundreds
 |
 |
PITTSFIELD, Mass. — Hundreds of job seekers perused job offerings Thursday from more than 45 local businesses.
The annual job fair at the Berkshire Hills Country Club, sponsored by the Berkshire Chamber of Commerce, is considered a huge success after the near-future's workforce filled the ballroom all day.
While the troubled economy has lowered hiring rates in the county in recently, this year was different. Employers filled the available spots quicker than ever before, according to Christine Hoyt, director of programs and events at the chamber.
By noon more than 200 people browsed a range of company booths – ranging from manufacturing to health care to banking – for jobs running the whole gambit of levels.
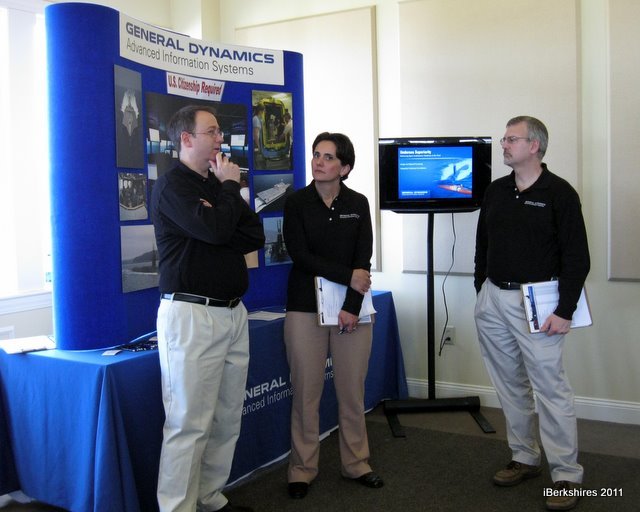
Companies included General Dynamics, which is planning to add 200 jobs this year, LTI Smartglass and Interprint, Onyx Specialty Papers, Wave Systems and InterTech and Dunkin' Donuts as well schools, training centers and career placement organizations.
Sponsors are BerkshireJobs.com, a sister site of iBerkshires, BerkshireWorks Career Center, Interprint Inc., Massachusetts College of Liberal Arts, Partnerships in Employment and New England Newspapers.
 |
| Tags: job fair |
State Jobless Rate Continues to Drop
BOSTON — Unemployment declined again across the state and was down about a half point from last year at this time. The Pittsfield metro area lost jobs in February, .3 percent, but its unadjusted unemployment rate is still lower than this time last year.
The Executive Office of Labor and Workforce Development reported that the February seasonally unadjusted unemployment rates were down in 19 labor market areas; up in one area, Fall River; and unchanged in Nantucket and Tisbury. Statewide, the February seasonally unadjusted unemployment rate was 8.7 percent, a decrease of 0.2 of a percentage point from the revised January rate of 8.9 percent.
Over-the-year, unemployment rates were lower in 20 of the 22 areas. The Amherst and Tisbury rates were up. Over-the-year, the state unadjusted unemployment rate was down 0.6 of a percentage point from the 9.3 percent rate in February 2010.
In February, over-the-month jobs gains occurred in four of the areas for which job estimates are published. They were Boston-Cambridge-Quincy; Springfield; New Bedford; and Worcester areas. Over-the-year job gains were realized in 10 of the areas while two had a loss. Job gains occurred in the Boston-Cambridge-Quincy, Worcester, Springfield, New Bedford, Barnstable, Brockton-Bridgewater-Easton, Haverhill-North-Andover-Amesbury, Framingham, Pittsfield and Leominster-Fitchburg-Gardner areas.
The Peabody and Lowell-Billerica-Chelmsford areas lost jobs.
The statewide seasonally adjusted jobs estimate released on March 17 showed a 15,400 job gain. The seasonally adjusted statewide February unemployment rate of 8.2 percent was down 0.1 of a percentage point over-the-month and down 0.6 of a percentage point from the 8.8 percent rate in February 2010. The Massachusetts statewide seasonally adjusted unemployment rate remains well below the national rate of 8.9 percent.
The unadjusted unemployment rates and job estimates for the labor market areas reflect seasonal fluctuations and therefore may show different levels and trends than the statewide seasonally adjusted estimates.
The March 2011 unemployment rate, labor force data and jobs estimates for Massachusetts will be released on April 14, 2011; local unemployment statistics will be released on April 19, 2011. Detailed labor market information is available at www.mass.gov/lmi.
| Tags: jobless rates |
Pittsfield, North Adams Jobless Rates Drop Slightly
BOSTON — The Executive Office of Labor and Workforce Development reports that the January seasonally unadjusted unemployment rates were up in all 22 labor-market areas, including Pittsfield, reflecting seasonal trends.
Statewide, the January seasonally unadjusted unemployment rate was 9.0 percent, an increase of 1.0 percentage point from the revised December rate of 8.0 percent. Despite adding jobs over January 2010, Pittsfield's unadjusted jobless rate is 9.3 percent and North Adams is 10.5. Both those rates are down fractionally over last year.
Over-the-year, unemployment rates were lower in 20 of the 22 areas. The Amherst and Tisbury rates were up. Over-the-year, the state unadjusted unemployment rate was down 0.6 of a percentage point from the 9.6 percent rate in January 2010.
In January seasonal influences resulted in over-the-month jobs losses in all 12 areas for which job estimates are published. However, over-the-year job gains were realized in nine of the areas while three had a loss. Job gains occurred in the New Bedford, Boston-Cambridge-Quincy, Worcester; Barnstable, Brockton-Bridgewater-Easton, Haverhill-North-Andover-Amesbury, Pittsfield, Leominster-Fitchburg-Gardner and Springfield areas. The Peabody, Framingham, and Lowell-Billerica-Chelmsford areas lost jobs.
The statewide seasonally adjusted jobs estimate released on March 3rd showed a 5,600 job gain. The commonwealth has added 33,800 jobs since December 2009. The seasonally adjusted statewide January unemployment rate of 8.3 percent was unchanged over-the-month and down 0.5 of a percentage point from the 8.8 percent rate in January 2010. The Massachusetts statewide seasonally adjusted unemployment rate remains well below the national rate of 9.0 percent.
The unadjusted unemployment rates and job estimates for the labor market areas reflect seasonal fluctuations and therefore may show different levels and trends than the statewide seasonally adjusted estimates.
NOTES: The local area unemployment rates and labor force data have been revised for 2010; the revised estimates for 2006 through 2009 will be published on March 29, 2011. The labor area jobs data have been revised for 2009 and 2010.
The February 2011 unemployment rate, labor force data and jobs estimates for Massachusetts will be released on March 17, 2011; local unemployment statistics will be released on March 29, 2011. Detailed labor market information is available at www.mass.gov/lmi. See the revised February, 2011 Media Advisory annual schedule for complete listing of release dates also at www.mass.gov/lmi.
Division of Unemployment Assistance
Labor Force, Employment and Unemployment
Massachusetts and Labor Areas
(Data not seasonally adjusted)| Location | Labor Force | Employment | Unemployment | Rate | ||||||||
| Jan 2011 |
Dec 2010 |
Jan 2010 |
Jan 2011 |
Dec 2010 |
Jan 2010 |
Jan 2011 |
Dec 2010 |
Jan 2010 |
Jan 2011 |
Dec 2010 |
Jan 2010 |
|
|---|---|---|---|---|---|---|---|---|---|---|---|---|
| Mass. | 3,482,900 | 3,488,300 | 3,464,900 | 3,171,000 | 3,209,100 | 3,130,800 | 311,900 | 279,200 | 334,000 | 9.0 % | 8.0 % | 9.6 % |
| Metropolitian Divisions | ||||||||||||
| Boston-Cambridge-Quincy | 1,541,284 | 1,542,443 | 1,532,459 | 1,426,878 | 1,437,727 | 1,408,122 | 114,406 | 104,716 | 124,337 | 7.4 % | 6.8 % | 8.1 % |
| Brockton-Bridgewater-Easton | 129,670 | 129,316 | 128,531 | 116,387 | 117,477 | 114,555 | 13,283 | 11,839 | 13,976 | 10.2 % | 9.2 % | 10.9 % |
| Framingham, NECTA |
148,411 | 148,310 | 148,682 | 138,378 | 139,131 | 137,500 | 10,033 | 9,179 | 11,182 | 6.8 % | 6.2 % | 7.5 % |
| Haverhill-N Andover-Amesbury, MA-NH | 124,596 | 124,353 | 123,924 | 114,509 | 115,367 | 112,520 | 10,087 | 8,986 | 11,404 | 8.1 % | 7.2 % | 9.2 % |
| Lawrence-Methuen-Salem, MA-NH | 75,130 | 74,578 | 73,052 | 65,344 | 65,543 | 63,095 | 9,786 | 9,035 | 9,957 | 13.0 % | 12.1 % | 13.6 % |
| Lowell-Billerica-Chelmsford, MA-NH | 155,408 | 155,525 | 155,512 | 141,515 | 142,899 | 140,002 | 13,893 | 12,626 | 15,510 | 8.9 % | 8.1 % | 10.0 % |
| Taunton-Norton-Raynham, MA | 64,649 | 64,050 | 64,269 | 58,447 | 58,627 | 57,609 | 6,202 | 5,423 | 6,660 | 9.6 % | 8.5 % | 10.4 % |
| Metropolitian Statisical Areas | ||||||||||||
| Barnstable, MA | 129,408 | 130,873 | 128,027 | 114,465 | 118,555 | 112,510 | 14,943 | 12,318 | 15,517 | 11.5 % | 9.4 % | 12.1 % |
| Boston-Cambridge-Quincy, MA-NH | 2,547,518 | 2,546,972 | 2,535,514 | 2,347,852 | 2,365,154 | 2,317,075 | 199,666 | 181,818 | 218,439 | 7.8 % | 7.1 % | 8.6 % |
| Leominster-Fitchburg-Gardner, | 74,113 | 73,872 | 73,944 | 65,509 | 66,033 | 64,976 | 8,604 | 7,839 | 8,968 | 11.6 % | 10.6 % | 12.1 % |
| New Bedford | 88,011 | 87,442 | 86,727 | 75,948 | 77,374 | 74,177 | 12,063 | 10,068 | 12,550 | 13.7 % | 11.5 % | 14.5 % |
| Pittsfield | 39,570 | 39,471 | 39,140 | 35,904 | 36,249 | 35,439 | 3,666 | 3,222 | 3,701 | 9.3 % | 8.2 % | 9.5 % |
| Providence-Fall River-Warwick, RI-MA | 152,181 | 151,191 | 151,844 | 132,874 | 134,935 | 130,729 | 19,307 | 16,256 | 21,115 | 12.7 % | 10.8 % | 13.9 % |
| Springfield, MA-CT | 347,539 | 349,900 | 346,627 | 311,642 | 318,289 | 309,387 | 35,897 | 31,611 | 37,240 | 10.3 % | 9.0 % | 10.7 % |
| Worcester, MA-CT | 297,730 | 297,215 | 296,462 | 269,854 | 271,904 | 266,646 | 27,876 | 25,311 | 29,816 | 9.4 % | 8.5 % | 10.1 % |
| Micropolitian Statisical Areas | ||||||||||||
| Amherst Center, MA |
23,037 | 25,815 | 22,991 | 21,616 | 24,454 | 21,605 | 1,421 | 1,361 | 1,386 | 6.2 % | 5.3 % | 6.0 % |
| Athol | 10,624 | 10,505 | 10,624 | 9,422 | 9,419 | 9,303 | 1,202 | 1,086 | 1,321 | 11.3 % | 10.3 % | 12.4 % |
| Greenfield | 22,122 | 22,199 | 22,096 | 20,150 | 20,426 | 19,941 | 1,972 | 1,773 | 2,155 | 8.9 % | 8.0 % | 9.8 % |
| North Adams, MA-VT | 17,580 | 17,645 | 17,498 | 15,736 | 16,023 | 15,584 | 1,844 | 1,622 | 1,914 | 10.5 % | 9.2 % | 10.9 % |
| Other Labor Market Areass | ||||||||||||
| Great Barrington, MA LMA |
16,762 | 16,822 | 16,651 | 15,461 | 15,712 | 15,272 | 1,301 | 1,110 | 1,379 | 7.8 % | 6.6 % | 8.3 % |
| Nantucket County/town LMA | 5,984 | 6,737 | 5,888 | 5,076 | 6,078 | 4,962 | 908 | 659 | 926 | 15.2 % | 9.8 % | 15.7 % |
| Tisbury, LMA | 9,535 | 10,030 | 9,520 | 8,280 | 9,012 | 8,306 | 1,255 | 1,018 | 1,214 | 13.2 % | 10.1 % | 12.8 % |
| Tags: unemployment |
Excelsior Brings Greeting Card Co. To North Adams
 Photo courtesy of Excelsior Photo courtesy of Excelsior |
NORTH ADAMS, Mass. — Excelsior Printing Co. will bring its newly acquired business to the city.
The Roberts Drive printing company announced Tuesday that it purchased Oatmeal Studios of Rochester, Vt., and will bring the inventory and warehousing to the city, which could translate into local jobs.
"The founders wanted to retire. We were in negotiations for about a month and finalized the deal last week," Julianne Fruscio, Excelsior's business development and marketing coordinator, said on Tuesday.
Excelsior has been printing Oatmeal Studios' greeting cards for more than 20 years. Oatmeal's sales team will be offered positions first and unfilled jobs could be filled locally. Additionally, Excelsior hired Joseph Gallagher to be the general manager to develop even more products and expand into other markets.
"We're really hoping to develop the brand Oatmeal more," Fruscio said. "It's a new direction for us because we are now specializing in greeting cards."
Though Excelsior has the ability to do its own design work, it will continue using Oatmeal's database of freelancers to design the cards. Oatmeal also accepts submissions on a daily basis, Fruscio said.
Oatmeal Studios was founded by Helene and Joe Massimino and has been creating and distributing greeting cards and notepads for more than 30 years. The greeting cards are printed with vegetable-based inks on recycled paper.
"We think it's a great fit," said Joe Massimino in a press release. "Excelsior has been a part of Oatmeal Studios almost from the beginning and they have a stationery pedigree of their own that will serve Oatmeal Studios’ customers well into the future."
In 2005, Excelsior separated from Crane & Co. and, in 2008, made a similar acquisition of SeedPrint. Excelsior now prints and ships seed packages while doing minimal design work.
Crane purchased the Excelsior companies — Excelsior Printing and Excelsior Process & Engraving — in 1970. Crane moved Excelsior Process & Engraving to the Robert Hardman Industrial Park in 1985 and then announced that it will close the Curran Highway location last year.
Excelsior Printing Co. on Roberts Drive was purchased by David W. Crane in 2005.
| Tags: North Adams, Excelsior, Oatmeal Design, Crane, greeting cards |


